Media Studies × Visual Design — Vancouver, BC

Chelsea Yu

I turn research, memory, and craft into things worth looking at —
photography, user experience, and brand design.

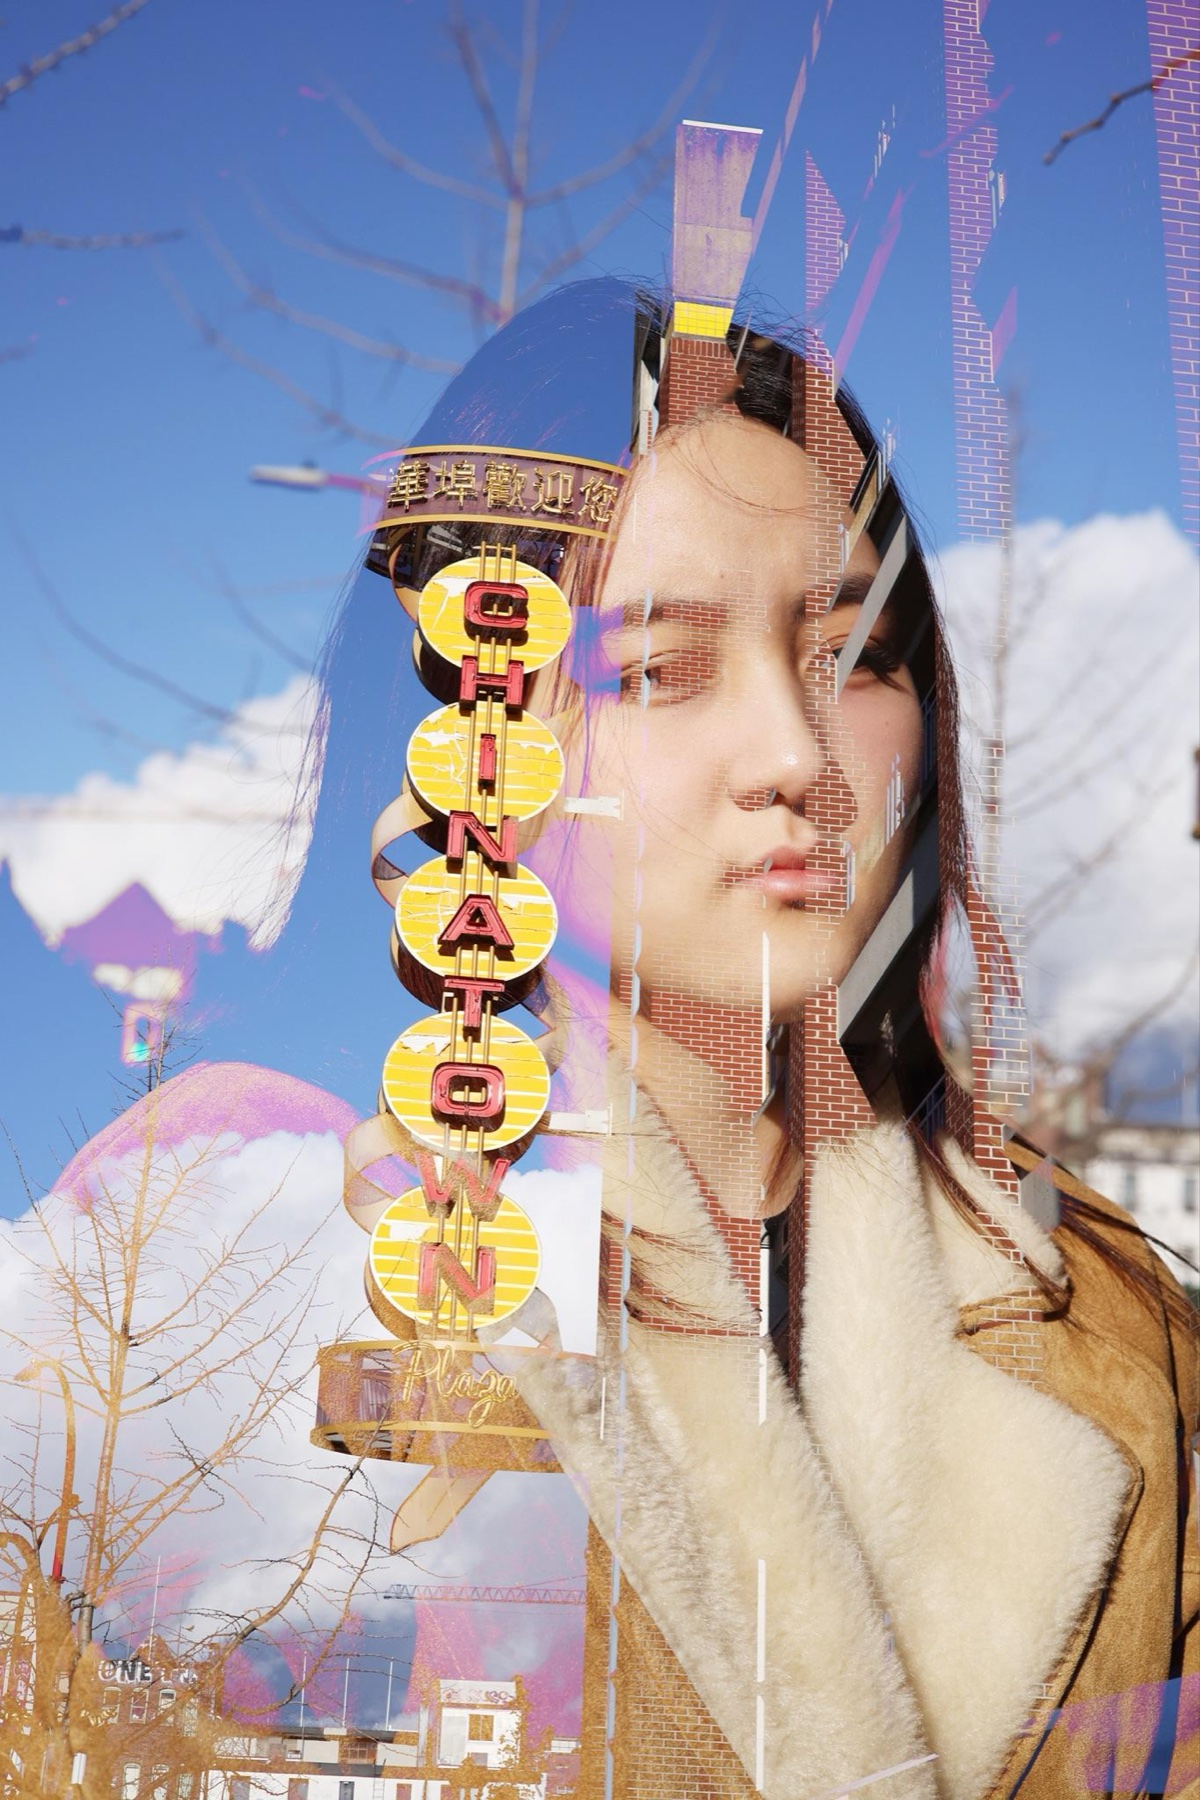
Double-exposure self-portrait fused with Vancouver Chinatown's gate signage, from the series The Chinese Echo
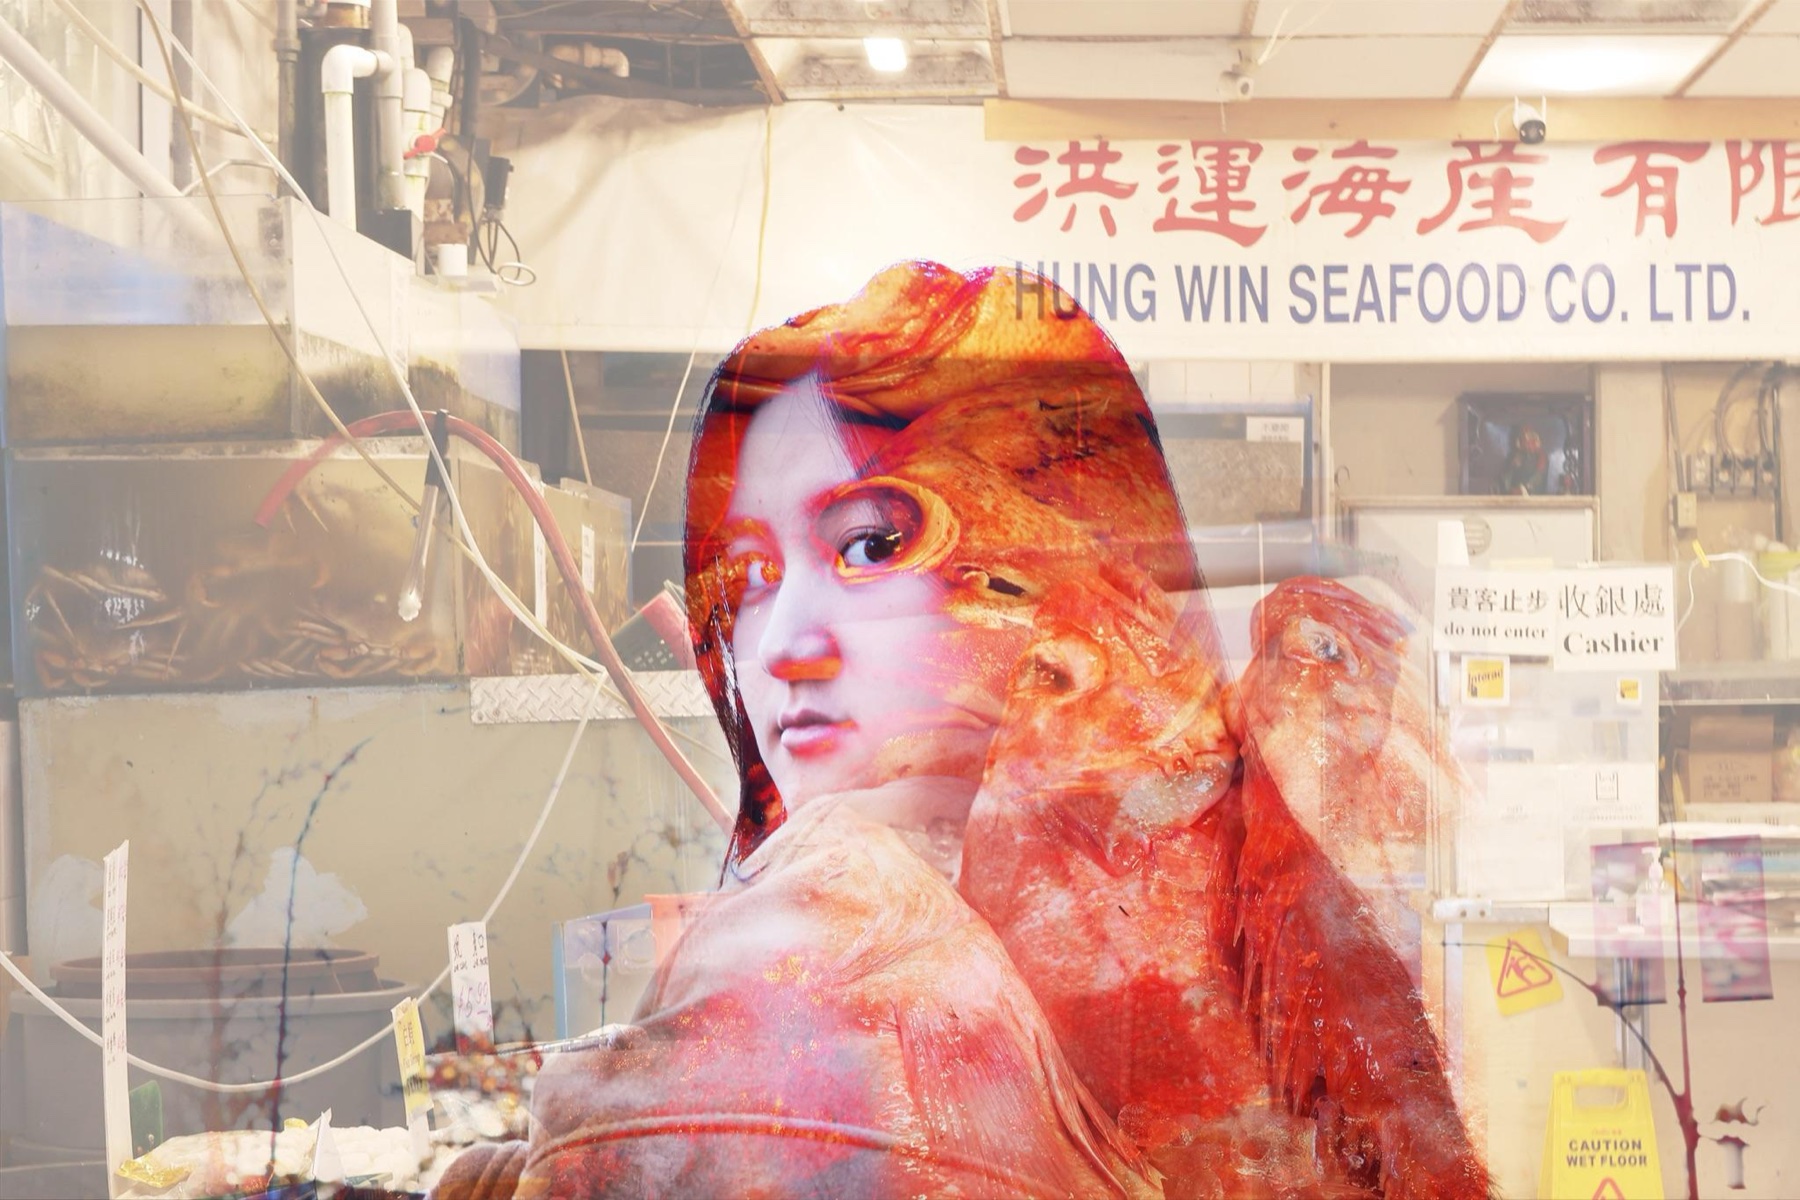
The Chinese Echo, 2023 — double exposure, Vancouver Chinatown
Scroll
01 — About

I'm a Media Studies student at UBC who thinks in images — bilingual, bicultural, and most at home where visual design meets research and story.

Raised between China and Canada, I make work that sits at the intersection of visual storytelling, user-centered design, and cultural identity — from double-exposure photography to Figma prototypes to posters seen by hundreds of students on campus. I care about the small decisions — a crop, a color, a transition — that make people actually feel something.

"It invites viewers to consider cultural heritage's dynamic and ever-changing nature in a globalized society."— from The Chinese Echo, artist statement
02 — Selected Work

Selected Work

01

The Chinese Echo

Fine-art photography series · double & triple exposure, Photoshop compositing

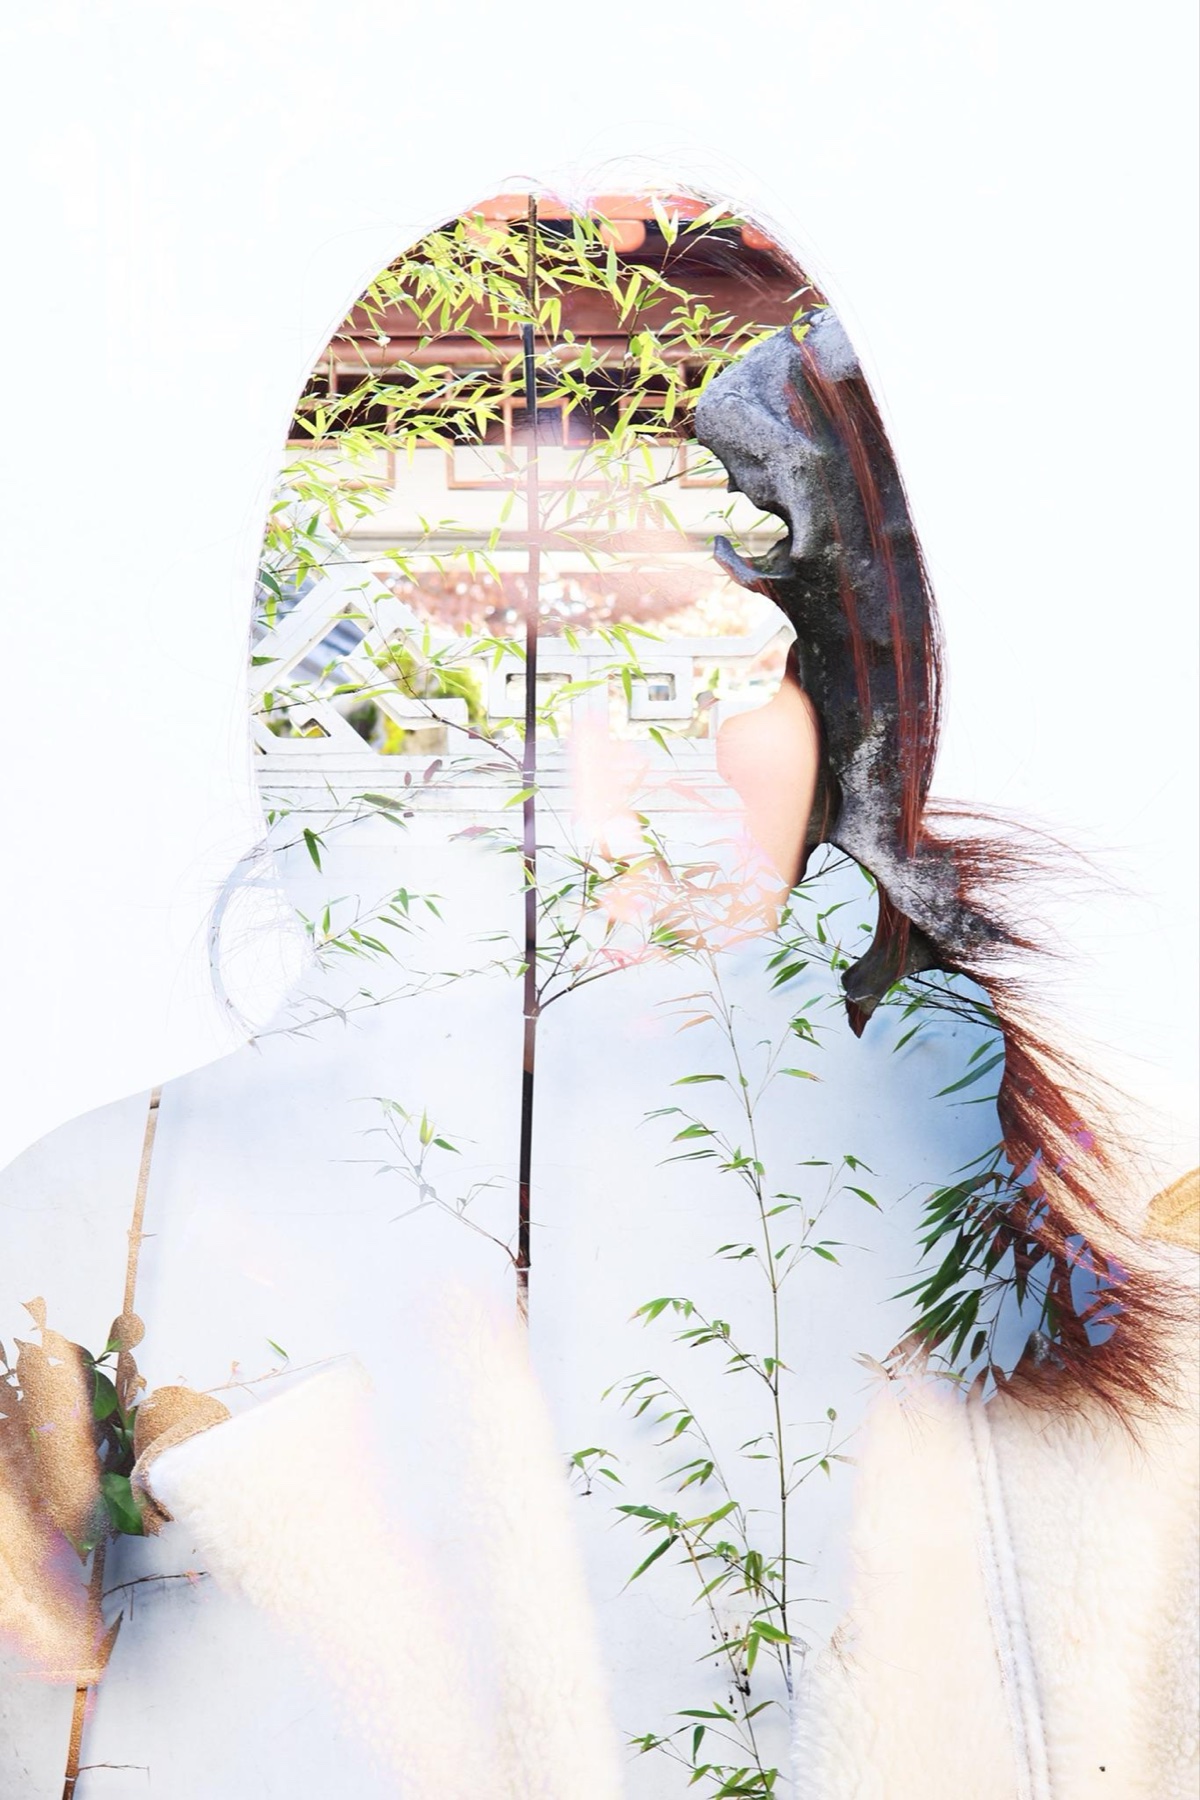
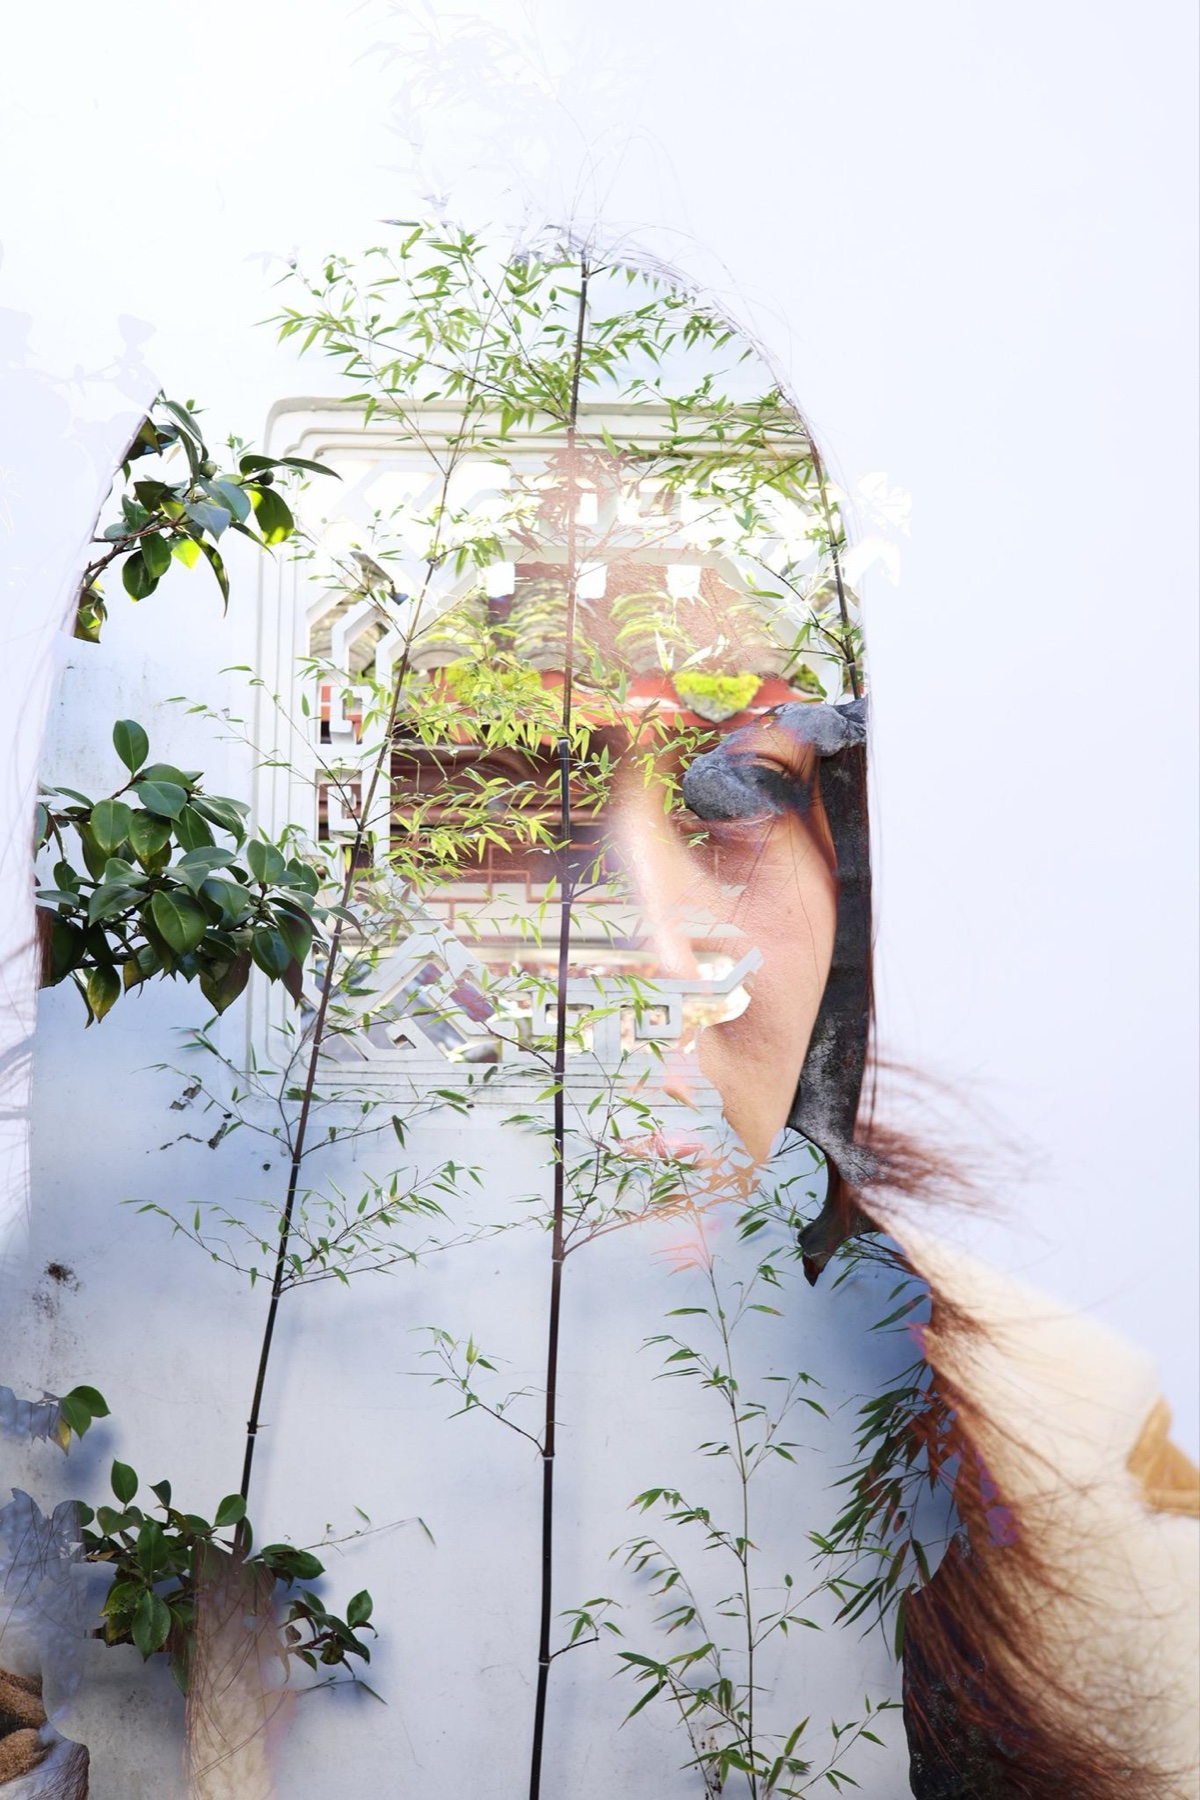
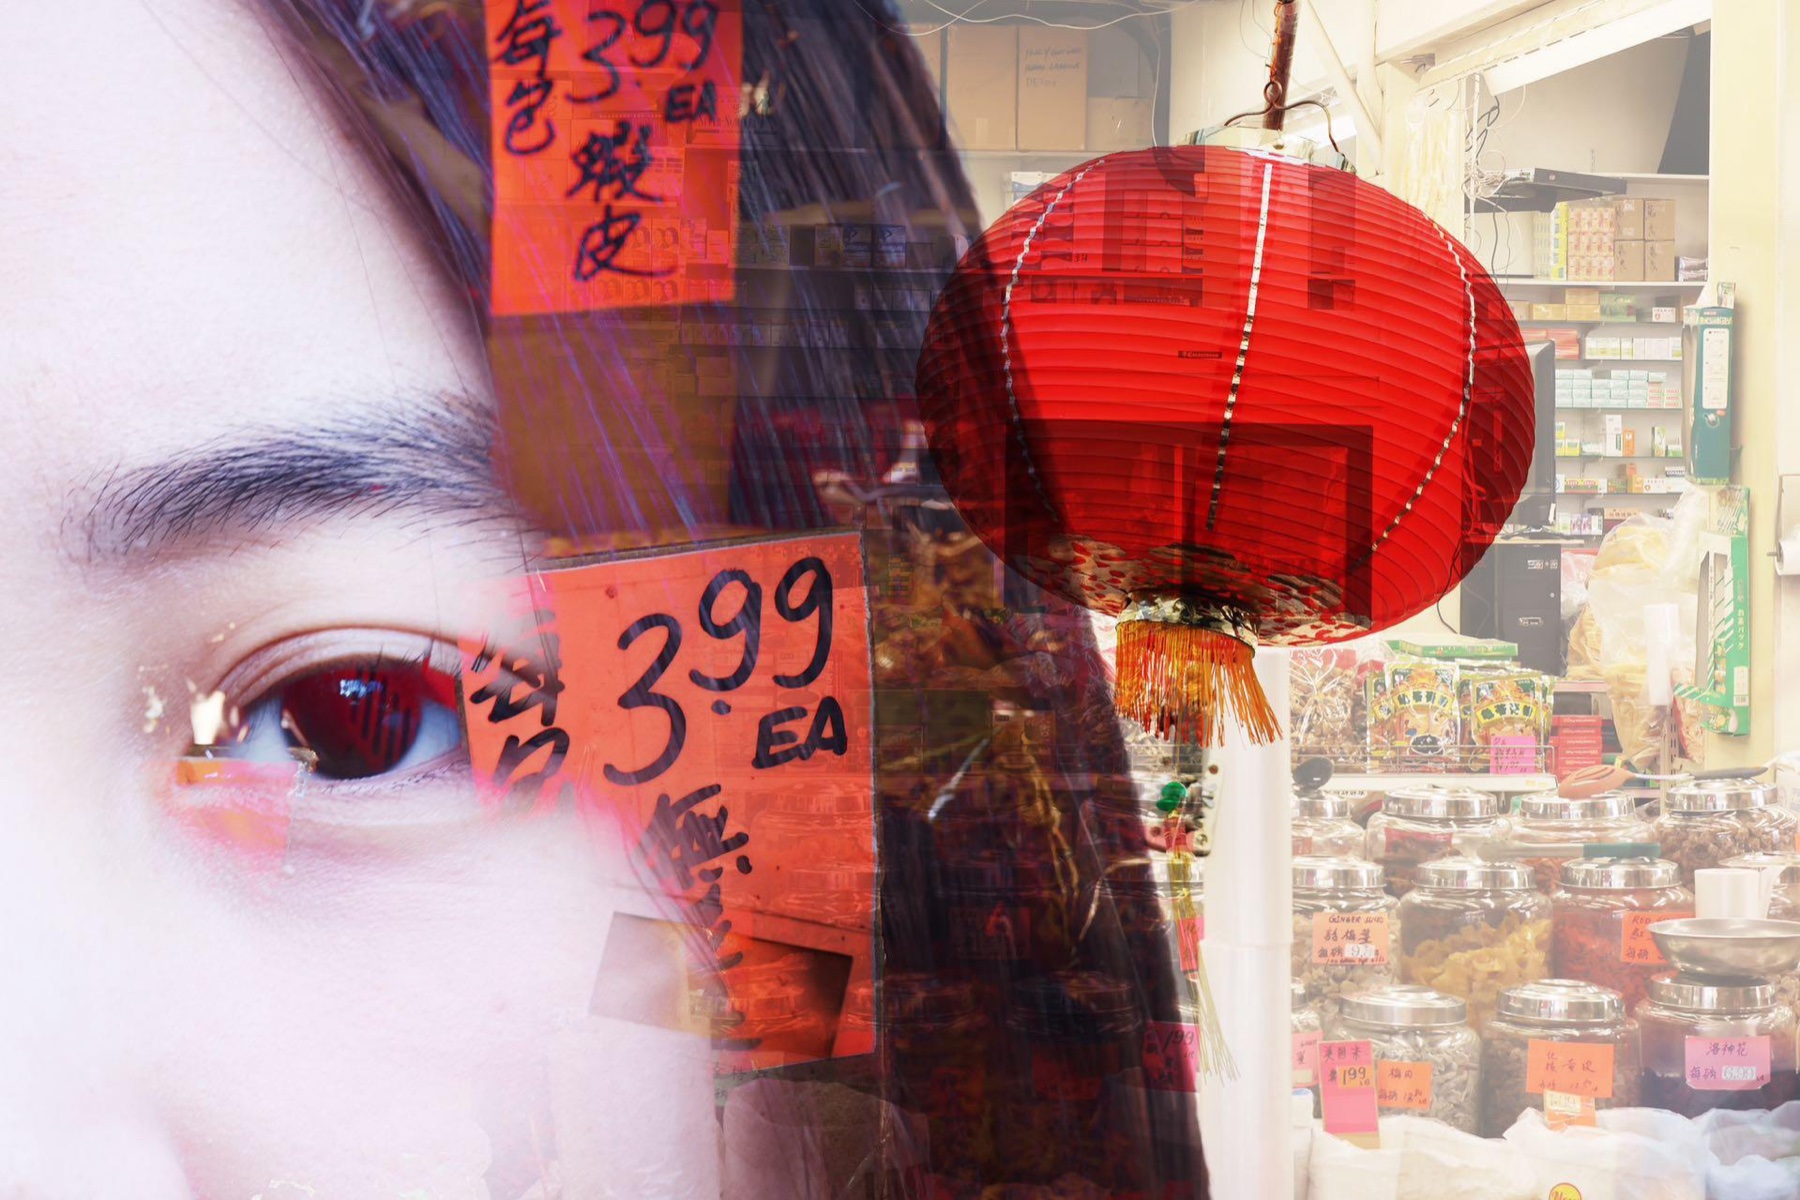
Double exposure of a portrait with a Chinatown seafood market, Hung Win Seafood Co. Double exposure portrait with Chinatown gate signage against a blue sky Double exposure portrait blended with a traditional Chinese garden Double exposure portrait blended with a traditional Chinese garden, second panel Double exposure close-up eye with a red lantern and herbal shop shelves

A personal photography series exploring the layered identity of Vancouver's Chinatown — and my own. Having grown up between China and Canada, I used double- and triple-exposure techniques to fuse self-portraits with the textures of the neighbourhood: a seafood market, an herbal shop, a Suzhou-style garden, the glow of the Chinatown gate. The result is a set of images about nostalgia, hybridity, and what gets lost and gained in translation between cultures.

02

La Poterie

Short documentary film · Director & Producer

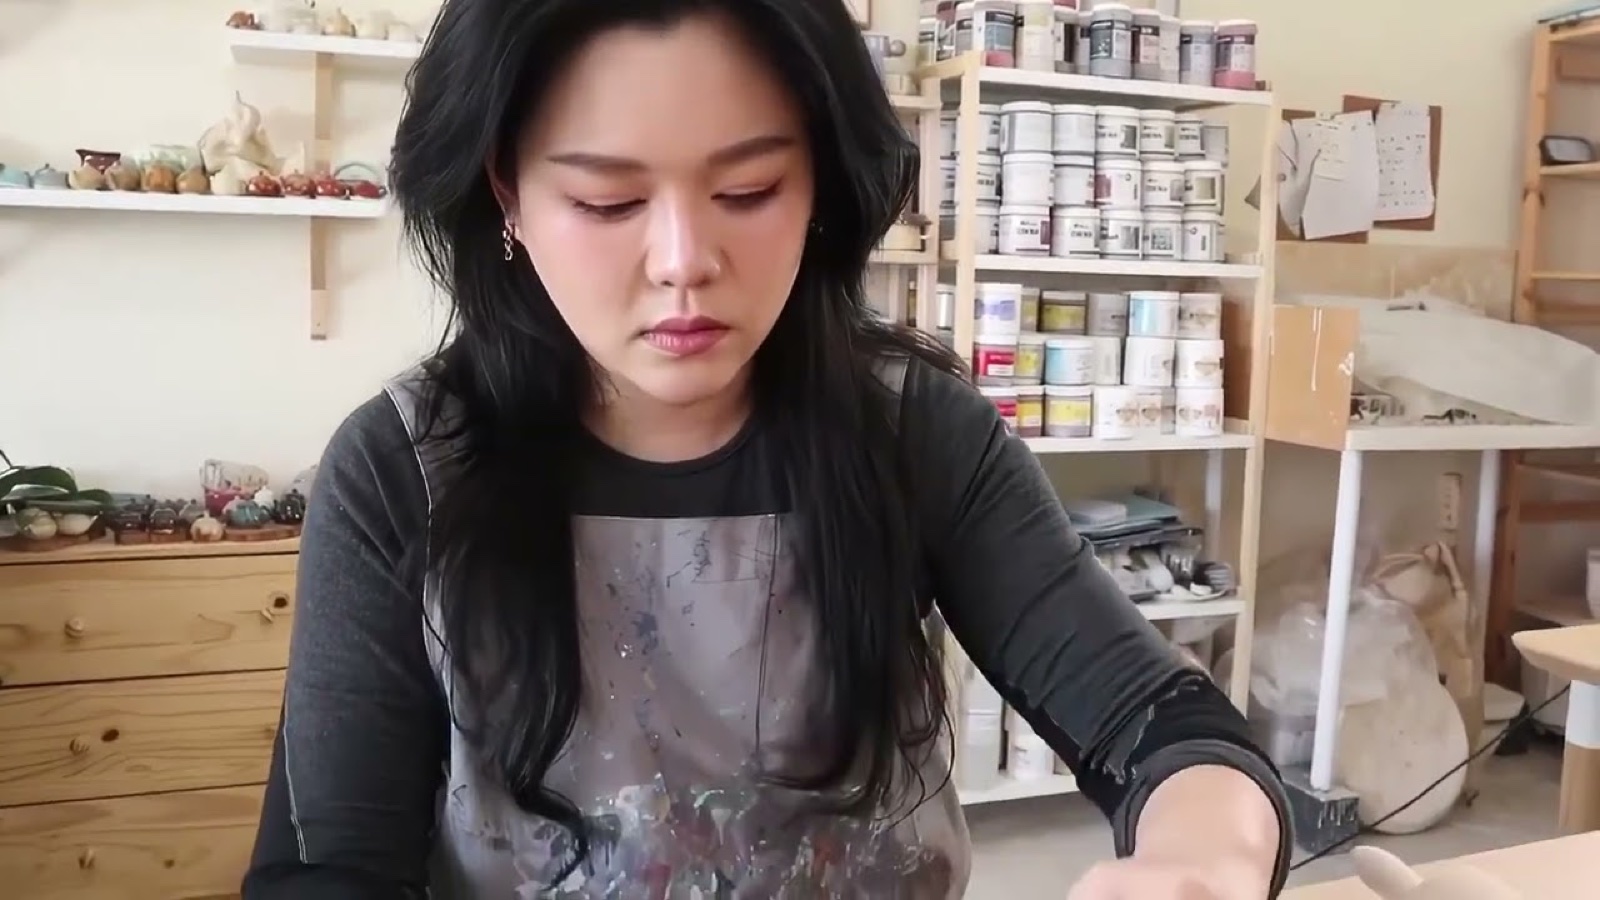
Still from La Poterie, a short film following the pottery-making process ▶ Watch on YouTube

A short, quiet film following the pottery-making process — kneading, wheel-throwing, shaping. As director and producer, I planned the shot list, storyboard, and lighting, and made deliberate calls on composition, pacing, and sequencing to let the texture of the clay and the patience of the craft carry the story.

03

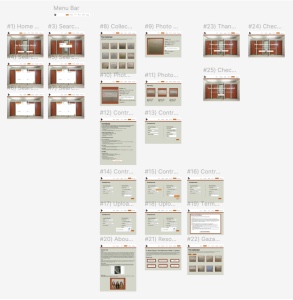
Building Personas from Experience

UX research & design · Figma

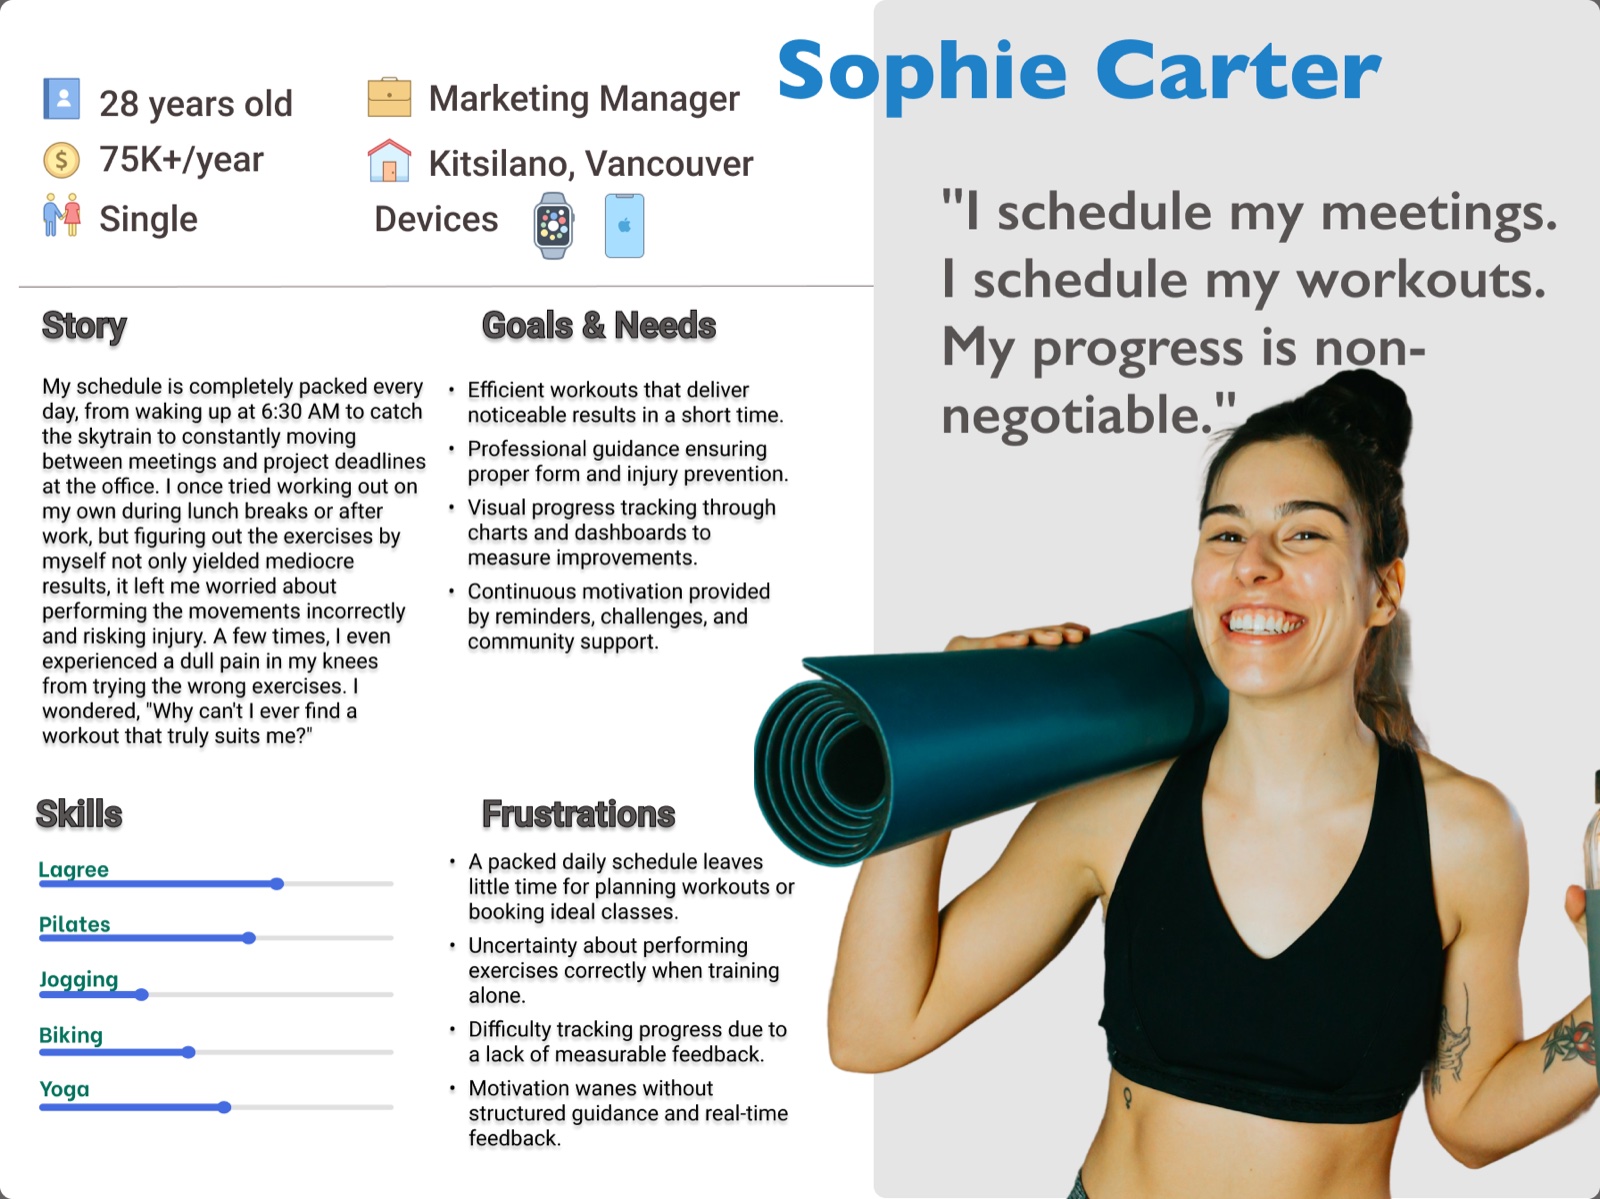
Born from my own frustration with scheduling Lagree classes around a packed calendar, this personal project turns a real problem into a full UX solution. I ran market research and user interviews, synthesized the findings into a data-driven persona, and used Figma to design an end-to-end product experience — from problem statement to prototype.

UX persona document for Sophie Carter, a 28-year-old marketing manager, showing her story, goals, skills, and frustrations
04

Posters & Campaigns

Event & social design · Canva

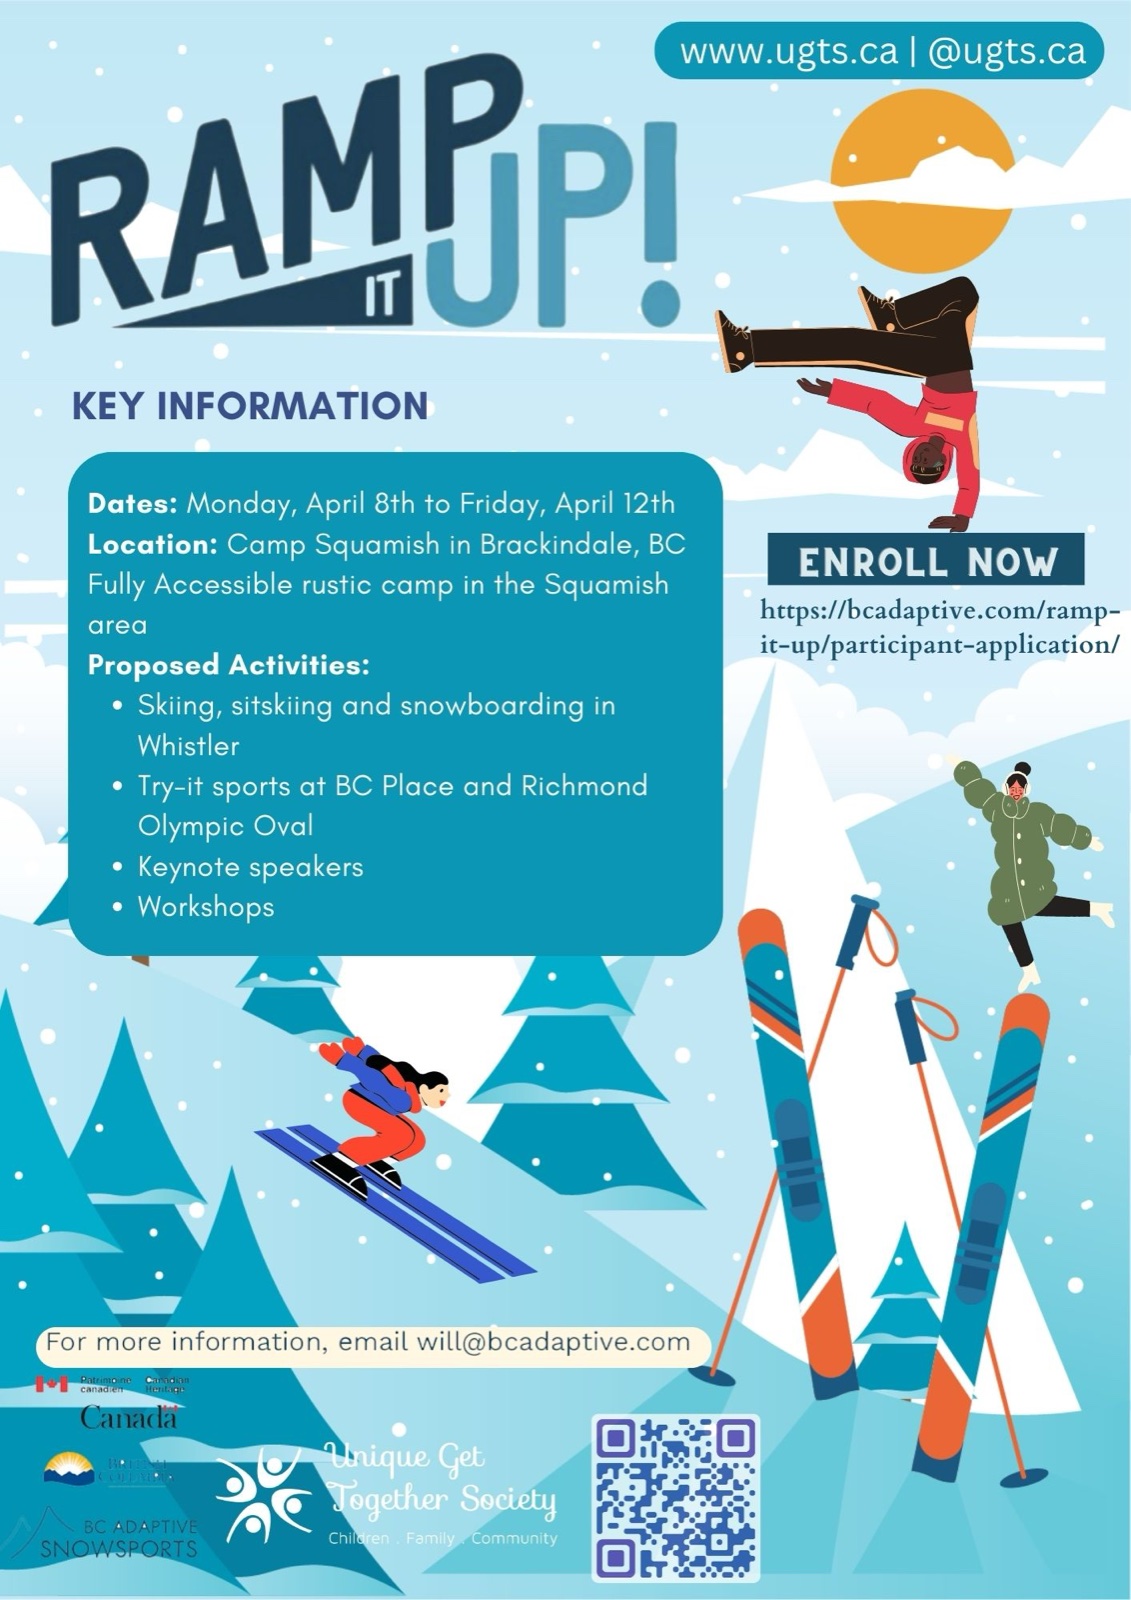
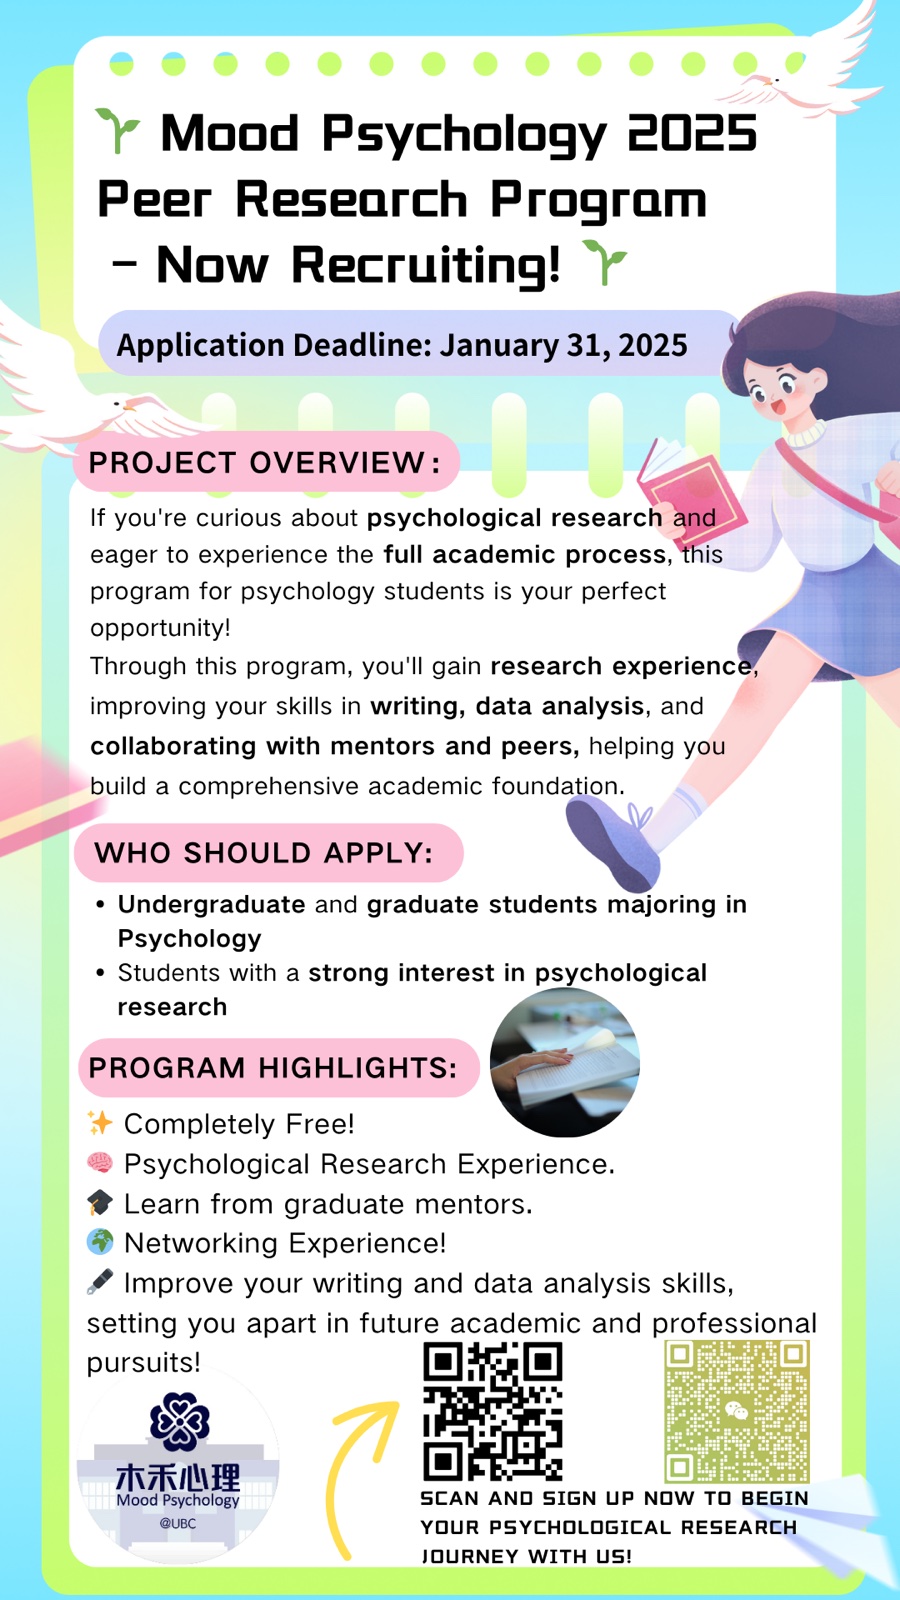
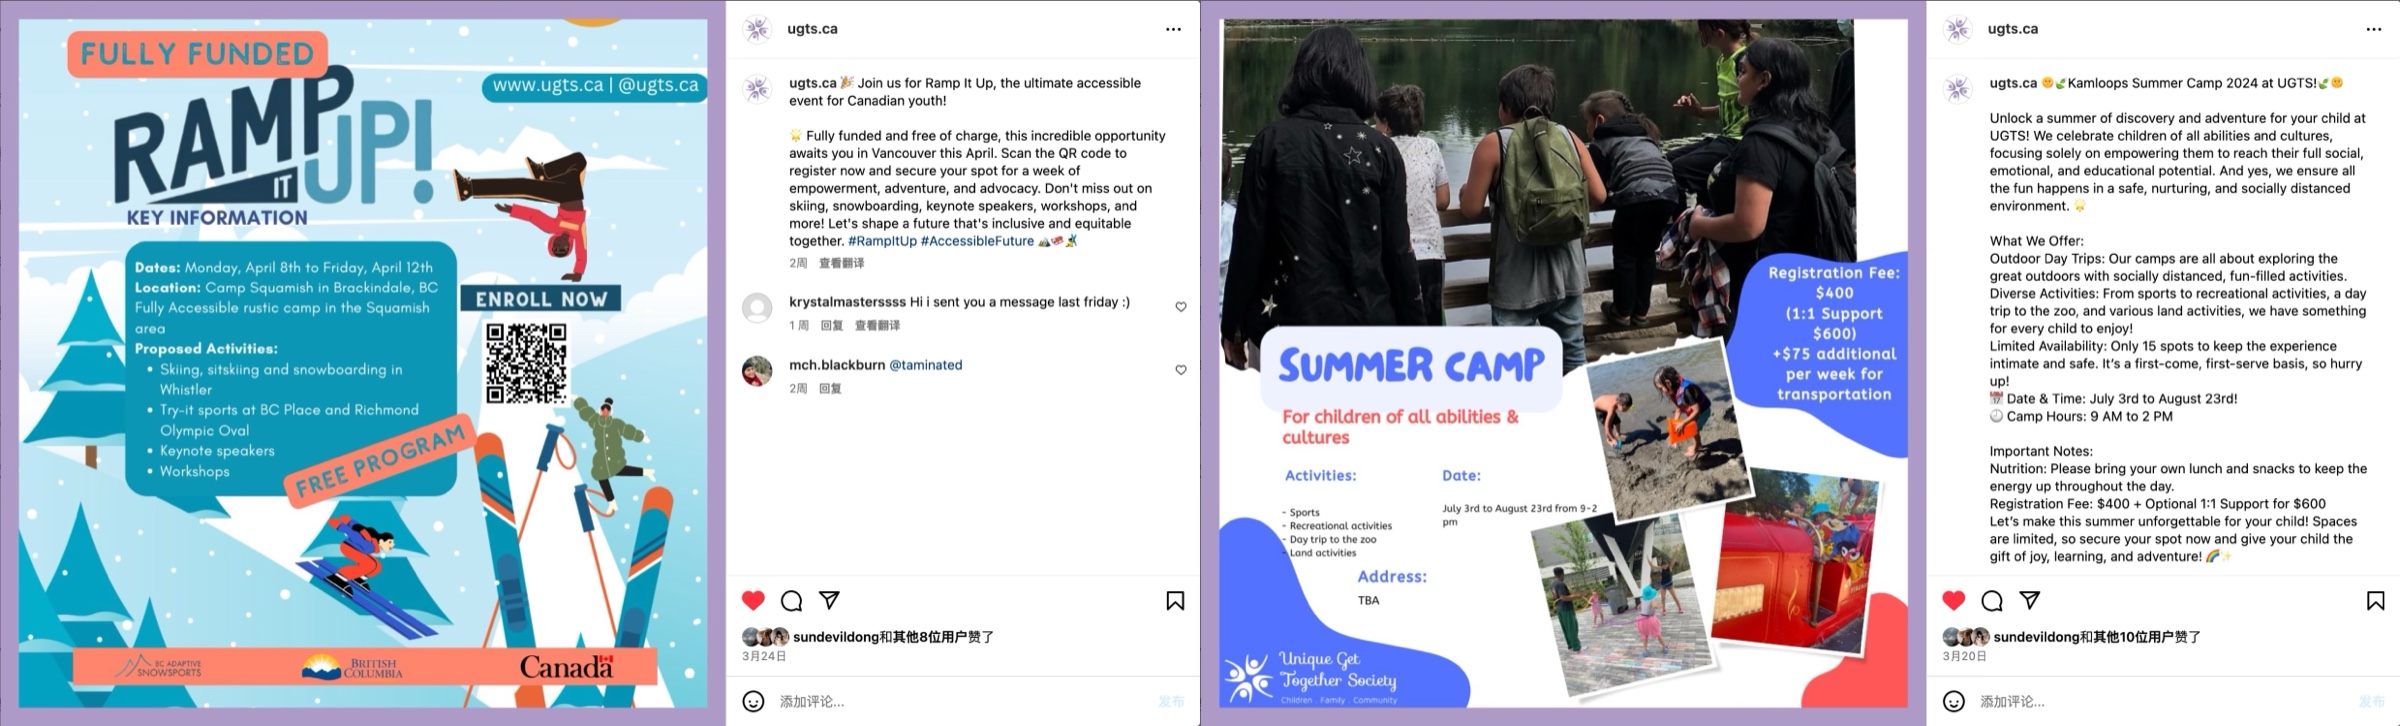
As Art Design lead for the UBC CSSA Life Department and a marketing volunteer with the Unique Get Together Society, I designed the posters and campaign materials that got people through the door — for a 300-person campus Halloween event, an accessible snowsports camp for youth with disabilities, and a peer research recruitment drive.

Ramp It Up! poster for an accessible snowsports camp Mood Psychology 2025 peer research program recruitment poster
05

From Raw Data to Interactive Dashboard

Data analysis & visualization · Tableau, Excel, Tableau Prep Builder

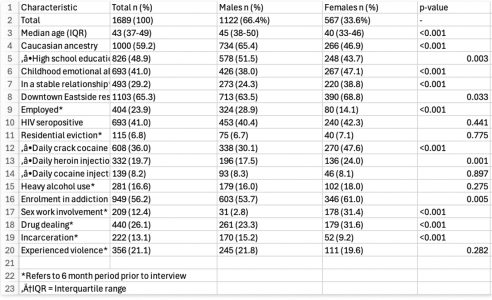
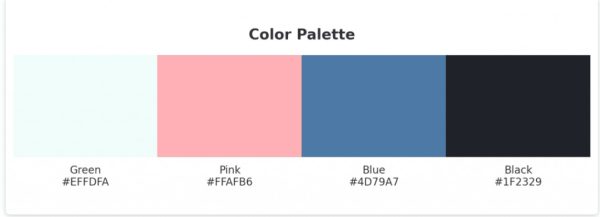
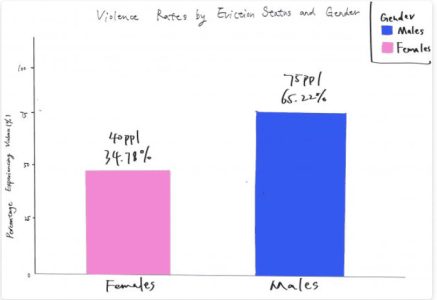
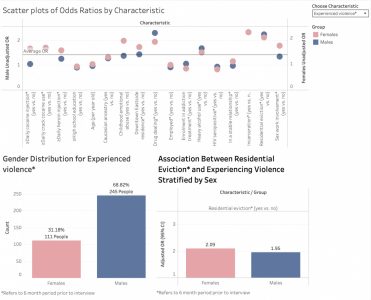
Inspired by UBC's Making Research Accessible Initiative, I worked with a team to turn a dense academic study on housing eviction and violence among people who inject drugs in Vancouver into an accessible, interactive dashboard. I cleaned corrupted, inconsistent data in Excel and Tableau Prep Builder, defined an accessible colour palette guided by the "Do No Harm" framework, sketched chart concepts by hand, then built and presented a Tableau dashboard that lets a general audience filter and explore the findings for themselves.

Raw, corrupted public health dataset before cleaning
01 · Raw data
Accessible colour palette: green, pink, blue, black
02 · Colour palette
Hand-drawn sketch of a bar chart comparing violence rates by gender
03 · Sketching
Final interactive Tableau dashboard with scatter plot and bar charts
04 · Final dashboard
03 — Skills

Skills & Tools

Design & Creative

  • Figma
  • Canva
  • Photoshop
  • CapCut
  • WordPress
  • User-Centered Design
  • Visual Storytelling

Research & Strategy

  • User Research
  • Persona Development
  • Data Visualization
  • Tableau
  • Market Research

Production & Tools

  • Excel / Sheets
  • Google Suite
  • PowerPoint
  • Project Coordination

Languages

  • English — Fluent
  • Mandarin — Fluent
04 — Experience

Experience & Education